Lesson 209: One Simple Introduction and One Simple Overview – Closures and Openings [Line Graph] [Introduction] [Overview] [Tutorials]

Đề:

The graph below shows the number of shops that closed and the number of new shops that opened in one country between 2011 and 2018.

Lần đầu đọc đề này mình cảm thấy hơi sợ vì hai cụm từ shops that closednew shops that opened không dễ sửa. Trong Lesson 208 mình đã tìm được khá nhiều phương án thay thế.

Tuy nhiên, trong bài này mình chỉ muốn dùng một chiến lược đơn giản, đó là:
1. dùng từ của hình vào Introduction
2. dùng từ của đề vào Overview

Nói một cách cơ bản thì mình có hai cụm từ thay thế như sau (viết theo thứ tự xuất hiện):
1. numbers of shop closures and openings
2. the number of shops that closed and the number of new shops that opened

Giờ mình đổi một tí:
2a. the numbers of shops that closed and opened
2b. the number of shops closing and the number of shops opening
2c. both figures

Mình sửa nhanh mở bài:

The line graph gives information about the numbers of shops closures and openings in a nation over a period of 7 years from 2011 to 2018.

Với tổng quan, xu hướng rõ là đi xuống. Nói cách khác thì S1 S2 . Viết luôn:

the number of shops closing ↓ and the number of shops opening ↓

Nói chung là:

both figures ↓

Để ý là trong hình còn có một điểm nhấn là some fluctuations. Mình gom vào cho đủ:

Overall, it is obvious that both figures declined despite some fluctuations over the period shown.

Nói tóm lại, muốn nhanhđơn giản thì như trên là được.

Lesson 206: Practice with Fluctuate – Bird Population [Line Graph] [Body] [Overview] [Vocabulary 1] [Tutorials]

Đề:

The graph below shows the birds’ population in Europe from 1977 to 2001.

Đề này mình ít triển khai vì là bài dạy trên trường. Hôm nay mình gặp một vài ví dụ khá hay của IELTS Advantage nên không muốn bỏ qua. Tranh thủ viết mấy dòng.

Trước tiên, mình chép lại ba câu mẫu. Câu đầu là cho Body. Nhận xét nhanh là câu này không có số liệu ở vế thứ hai.

Nuclear and renewable energies all represented around 4q in 1980 and fluctuated up until 2008.

Câu sau thấy ngay là một Overview và cụm The most noticeable trend is that… mình chưa dùng bao giờ. Để hôm nào thử.

The most noticeable trend is that burglary fell dramatically over the period. Car theft fluctuated until 2008, upon which it rose steadily; whereas the number of robberies remained relatively stable between 2003 and 2012.

Ví dụ số ba nếu thay over the period thì có thể nói là ổn cho đề trên.

Minutes spent on local calls fluctuated over the period, with just over 70 billion minutes in 1995, peaking at approximately 90 billion in 1999 and then steadily decreasing to just over 70 billion minutes in 2002.

Giai đoạn 1986-1989-1992 có ↑ và ↓ rất hợp để thử nghiệm với ví dụ ba. Mình thay thời gian vào trước.

The number of birds fluctuated between 1986 and 1992,…

Vì tí nữa phải dùng đến năm nên mình né đi.

Over the following 6 years, the number of birds fluctuated,…

Để triển khai được ví dụ ba cần ba mốc:

1986 – approximately 97 million birds
1989 – nearly 104 million birds
1992 – above 93 million birds

Số liệu cũng đại khái thôi. Mình mở rộng:

1986 – with approximately 97 million birds
1989 – reaching nearly 104 million birds
1992 – and then steadily falling to above 93 million birds

Tổng kết nhanh:

Over the following 6 years, the number of birds fluctuated, with approximately 97 million birds in 1986, reaching nearly 104 million birds in 1989, and then steadily falling to above 93 million birds in 1992.

Nhìn qua thấy cũng ổn. Nhưng mà mình thấy nó cứ rườm rà. Ví dụ mình dùng before thì câu trên ngắn hơn rất rất nhiều.

Over the following 6 years, the number of birds increased to nearly 104 million birds in 1989, before steadily falling to above 93 million birds in 1992.

Mà như thế này thì còn được tính điểm Grammar nữa. Tuy không phải là câu gì ghê gớm nhưng cũng được xem là một cấu trúc khác.

Mình nghịch thử một tí với ví dụ đầu. Chỉ là thử thôi vì mình sẽ cho nó fluctuate đến tận năm cuối luôn. Mà mình viết thế thì cũng chẳng sai, chỉ bị thiếu từ thôi.

The bird population stood at approximately 97 million birds in 1986 and fluctuated up until 2001.

Ví dụ hai thì chả có gì đặc biệt nên thôi. Các sách đều đề cập đến từ này mà các giám khảo không thấy họ dùng mấy, trừ trong Overview.

Lesson 199: Three Overviews for Energy Capacity [Pie] [Overview] [Tutorials]

Đề:

The pie charts below compare the proportion of energy capacity in gigawatts (GW) in 2015 with the predictions for 2040.

Phần trước mình đưa ra được hai kịch bản như sau:

Overview 1:
Fossil Fuels chủ đạo trong hai năm.
Renewables tăng sau 25 năm.

Overview 2:
Solar bé nhất trong năm 2015.
Trong khi Fossil Fuels chủ đạo trong cùng năm.
Năm 2040, Solar + Wind tăng.
Cùng lúc, Nuclear, Other Renewables, và
Fossil Fuels giảm.

Với phương án tập trung vào Fossil Fuels mình có mấy kiểu lận:

fossil fuels is the main source of energy
fossil fuels represents the majority of total energy generation capacity
the primary source of energy for power generation was from fossil fuels

Còn các bạn ghép vào năm 2015 hay cả hai năm thì tùy.

Bây giờ mình lần lượt xử lý mấy thằng còn lại:

production of renewables will increase sharply
a jump in renewable energy generation is expected (*)
an increase in solar and wind production is projected (**)
production of fossil fuels, nuclear, and other renewables will drop

Chuyện tăng, giảm đương nhiên phải xảy ra ở giữa 2015 và 2040 nên đừng hỏi về Tense.

(*) Nói chung thôi. Hơi gượng khi gom vào như thế này.
(**) Thiếu others và có lẽ chính xác hơn về mặt thông tin.

Mình bổ sung ý phụ và hoàn thiện:

Overall, it is clear that fossil fuels is the main source of energy over the period shown, however dependence on this nonrenewable energy type is expected to reduce in 2040. Meanwhile, it is estimated that total renewable energy production will increase sharply in the future.

Overall, it can be seen than fossil fuels represents the majority of total energy generation capacity in both years. It is also clear that a sudden jump in production of renewable energy sources is projected over the following 25 years.

Overall, it is obvious that solar power plants produced the least energy in 2015, whereas the primary source of energy for power generation was from fossil fuels. It is also true that while an increase in solar and wind production is projected, the amounts of energy generated using fossil fuels, nuclear, and other renewables are likely to drop.

Lesson 198: Too Much to Say – Energy Capacity [Pie] [Body] [Overview] [Tutorials]

Đề:

The pie charts below compare the proportion of energy capacity in gigawatts (GW) in 2015 with the predictions for 2040.

Mình tổng kết số liệu.

Fossil Fuels Other Renewables Nuclear Wind Solar
2015 64 44 6 5 2
2040 23 21 5 12 18

Mình cố tình chia thành hai nhóm tăng, giảm. Tí tách ra làm hai đoạn như sau:

Body 1: Fossil Fuels + Other Renewables + Nuclear 3↑
Body 2: Wind + Solar 2↓

Nhưng cũng có thể gộp như thế này:

Body 1: Wind ↑ + Solar ↑ + Other Renewables
Body 2: Fossil Fuels ↓ + Nuclear

Nếu rảnh mình sẽ viết luôn cả hai cách xem cái nào tối ưu hơn. Nhìn nhanh thì có vẻ gộp theo nhóm renewablenon-renewable nghe hàn lâm hơn.

Đấy là vấn đề tăng, giảmphân loại. Mình tập trung vào chuyên môn của Overview là phải tìm ra được đặc điểm nổi bật. Dễ thấy:

Fossil Fuels to nhất trong hai năm.
Other Renewables không đổi, chiếm 1/4.
Solar + Wind + Nuclear chiếm dưới 10% mỗi thằng vào năm 2015.
Solar x10, còn Wind x2 sau 25 năm.

Suy rộng thêm một tí thì:

Fossil FuelsNuclear = Non-renewables giảm.
Solar + Wind tăng dù nhóm Other Renewables không tăng nhưng vẫn có thể tuyên bố Renewables tăng nói chung.

Đề này chia làm hai giai đoạn nên khi mình viết Overview hai câu mình viết dễ hơn. Tạm thời mình chọn ra mấy ý như sau:

Overview 1:
Fossil Fuels chủ đạo trong hai năm.
Renewables tăng sau 25 năm.

Overview 2:
Solar bé nhất trong năm 2015.
Trong khi Fossil Fuels chủ đạo trong cùng năm.
Năm 2040, Solar + Wind tăng.
Cùng lúc, Nuclear, Other Renewables, và
Fossil Fuels giảm.

Lesson 179: Simple Ideas – Cultural Activities and Sports [Bar Graph] [Overview] [Tutorial] [Part 2]

Đề:

The charts below show the percentage of boys and girls aged 5-14 taking part in cultural activities and sports in Australia in 2003.

Ý tưởng chắt lọc của phần trước đây.

6. Trong 5 nhóm thì 3 nhóm nữ nhiều hơn nam. Riêng Cultural Activities nữ chiếm chủ đạo 3/4.
7. Nữ nổi bật trong Dancing.

Về chi tiết nữ nhiều hơn nam, mình viết: There were more girls than boys participating in… (1)

Nếu nói nữ chiếm đa số mình sẽ viết thế này: A vast majority of girls participated in …, compared to other cultural activities. (2) Câu này hợp lý cho hình đầu.

(1) có thể được viết ngược lại: … participation rates were slightly higher for girls than for boys. (3)

Tận dụng cách gọi tên vấn đề trong Lesson 15, mình có câu: Regarding …, girls had a higher participation rate than boys. (4)

Trong khi tìm từ thay thế mình thấy câu này rất hay: The most popular cultural activity for female participants was … (5) Tuy nhiên, chỉ nên dùng câu này cho hình đầu, thành ra hơi gò bó. Mà có lẽ nên đưa xuống Body và nối với ý so sánh với nam.

(1) còn có phương án nữa: Significantly more girls participated in … than boys. (6)

Mình nghĩ đến hai phiên bản sau:

1.(2) + (1)
There were more boys than girls participating in sport. A vast majority of girls participated in dancing, compared to other cultural activities.

2. (5) + (6)
The most popular cultural activity for female participants was dancing, while… Significantly more girls participated in cultural activities than boys.

Nếu mình viết (1) theo hướng có tới 4/5 hoạt động có hiện tượng nữ hơn nam thì: There were more girls than boys participating in cultural activities and sport, except for playing musical instrument. (7) Như phương án (7) này thì khỏi viết câu thứ hai cho Overview.

Tổng kết lại thì mình có:

1. Overall, it is true that there were more boys than girls taking part in sport. It is also clear that a vast majority of girls participated in dancing, compared to other cultural activities.

2. Overall, it is noticeable that the most popular cultural activity for female participants was dancing, while participation in playing musical instrument and sport is higher for boys than girls. It is also clear that significantly more girls participated in cultural activities than boys.

3. Overall, it is obvious that there were more girls than boys participating in cultural activities and sport, except for playing musical instrument.

Mình gạch đi câu hai của (2) vì thấy hơi loằng ngoằng.

Lesson 177: Simple Ideas – Cultural Activities and Sports [Bar Graph] [Overview] [Tutorial] [Part 1]

Đề:

The charts below show the percentage of boys and girls aged 5-14 taking part in cultural activities and sports in Australia in 2003.

Hình một nhìn hơi rắc rối. Mình thử viết xuống mấy ý tưởng.

1. DramaSinging tỷ lệ nam nữ bằng nhau.
2. DramaSinging dưới 5%.
3. Với Play Music Instrument thì nữ = 2/3 nam.
4. Dancing thì nữ vượt trội.

Hình hai thì dễ hơn.

5. Nam nhiều hơn nữ trong Sport.

Giờ mình gộp vào và thấy.

6. Trong 5 nhóm thì 3 nhóm nữ nhiều hơn nam. Riêng Cultural Activities nữ chiếm chủ đạo 3/4.
7. Nữ nổi bật trong Dancing.

Mình nghĩ mình sẽ phát triển Overview theo hướng này. Những chi tiết mình chỉ ra bên trên nên để dành cho Body. Chứ giờ nói hết thì tí lấy gì mà nói.

Mình tạm dừng ở đây với hai ý 6-7. Sang phần sau mình sẽ triển khai chi tiết và sẽ có chỉnh sửa (nếu cần).

Lesson 166: Overviews with Six Pies – Water Consumption [Pie] [Overview] [Vocabulary 1] [Tutorials] [Part 2]

Đề:

The charts below show the percentage of water used for different purposes in six areas of the world.

Phần trước mình đã phát triển một hướng đi là theo purpose và giờ mình thử theo region. Dưới đây là ý đồ ban đầu.
1. ba thằng bên dưới có xu hướng giống nhau (3)
2. các khu vực khác xu hướng đa dạng/ khác nhau (4)
Chỉnh sửa một tí thì sẽ như thế này.
1. ba thằng bên dưới và thằng South America có xu hướng giống nhau (5)
2. hai khu vực còn lại xu hướng khác nhau (6)
Phát triển theo hướng nào là tùy mỗi người.

Với ý đồ đi theo region mình sẽ thử áp dụng một từ mới (giống cách mình phát triển Introduction theo compare). Mình lấy từ này trong ví dụ sau:

The pie charts show household spending patterns in the UK and New Zealand between 1980 and 2008.

Và giờ mình biến thành của mình.

a similar pattern in water consumption
water consumption patterns are similar

Mình tra thử thấy mấy cụm này không sai. Giờ quan trọng là ghép vào nghe có ngang không vì (3) và (4) ý đồ giống nhau là đều dùng pattern.

Mình nháp đã:

A, B, and C shows a similar pattern in their water consumption… (3a)

The consumption patterns of water D, E, and F are diverse. (4a)

Mình phân vân (3a) có nên viết ngược lại hay không? Chính là kiểu viết của (4a).

The water distribution patterns in A, B, and C are similar. (3b)

(3a) cũng có cách viết khác:

… in water distribution, in their consumption of water, in the patterns of water usage

Mình khá là phân vân (4a) vì khi nói diverse/ different là mấy thằng này so với nhau hay so luôn cả với bọn còn lại? Hay là mình đổi cách nói.
0. tại A và B có nhiều kiểu khác nhau (7)
Mình thử phát triển (7).

There are a variety of/ several patterns of water consumption in D, E, and F. (7a)

Mình nghĩ (7a) mạnh hơn (4a).

Túm cái váy lại:

Overall, it is noticeable that the water distribution patterns in the two Asian areas and Africa as a whole are similar, whereas there are a variety of patterns of water consumption in the other regions.

Mình thử phát triển từ mới nên sẽ giữ nguyên từ pattern ở cả hai vế.

Lesson 165: Overviews with Six Pies – Water Consumption [Pie] [Overview] [Tutorials] [Part 1]

Đề:

The charts below show the percentage of water used for different purposes in six areas of the world.

Để làm được phần này phải nhìn nhanh một tí mấy điểm nổi bật.
1. agriculture được dùng nhiều nhất, ngay cả khi industryhome kết hợp (1)
2. industry tại hai region chiếm đa số (lờ đi thằng home) (2)

Nhưng cũng có cách chia khác là theo region.
1. ba thằng bên dưới có xu hướng giống nhau (3)
2. các khu vực khác xu hướng đa dạng/ khác nhau (4)

Trước khi mình đắp thịt cho mấy Overview này, cần lưu ý các bạn là một khi đã có ý đồ, hãy triển khai ngay bất kể nội dung nghe phi hợp lý đến đâu. Đây chỉ là luyện tập thôi nên mọi người đừng rườm rà quá trong tư duy. Task 1 có mỗi 20′ nghĩ gì mà lắm! Hãy mạnh dạn vạch ý đồ và chuyển ngữ ngay và luôn.

Trước tiên là với (1).

more water is used for agricultural purpose (1a)
agriculture accounts for the vast majority of water usage (1b)

Ở điểm kết hợp mình thử như sau, industry and homes combined. Mình tham khảo từ ví dụ dưới của Simon. Thú thật là mình ít thấy ông này dùng combined nhưng cứ dùng đi vì có hãng mẫu rồi.

The US produced more waste than the other countries combined.

Mình thử sửa một tí (1a):

More water is used by agriculture than by industry and homes combined in…

(1b) thì mình không đổi. Thêm thằng địa điểm nữa là tuyệt vời.

More water is used by agriculture than by industry and homes combined in most of the areas. (1c)

Agriculture accounts for the vast majority of water usage in all areas mentioned, except for North America and Europe. (1d)

Tận dụng luôn cách viết (1d) cho (2).

Industry accounts for the vast majority of water usage in North America and Europe. (2a)

Có thể thấy ngay (1d) và (2a) đối lập nhau. Vì vậy mình sẽ tổng kết một Overview với (1c) và (2a).

Overall, it is true that more water is used by agriculture than by industry and homes combined in most of the areas. It is also true that industry accounts for the vast majority of water usage in North America and Europe.

Mình nghĩ viết như trên là tạm ổn rồi. Dù gì nếu có ai phản đối câu đầu, mình đã cài cụm in most of the areas.

Lesson 163: One Problem with Two-Sentence Overviews – Internet Users [Line Graph] [Overview] [Tutorials]

Đề:

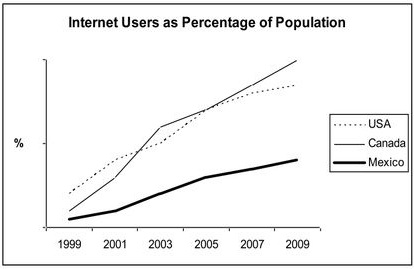
The graph shows the percentage of Internet users in three countries from 1999 to 2009.

6a0120a5bb05d8970c0133f3433b15970b-500wi

Mình đã có hướng phát triển Overview của đề này. Tuy nhiên, khi nối vào thấy cừ rườm rà nên mình tạm để đấy không làm gì cả. Vèo cái cả tháng rồi mà bài vẫn y như cũ. Hôm nay mình cố xử lý cho xong.

Đầu tiên, theo như gợi ý của Lesson 4 thì:

There was an upward trend in the proportion of Internet users in each country over the 10-year period. (1)
Both USA and Canada had far higher percentages of people using the Internet than Mexico. (2)
The fastest growth in Internet usage was witnessed in Canada. (3)

Công thức Overview của mình như sau:

Overall, it is true that… It is also clear that… (*)

Tuy nhiên, mình định ghép (2) và (3) bằng while.

While both USA and Canada had far higher proportions of the online population than Mexico, the fastes growth in Internet usage was witnessed in Canada. (4)

Tuy nhiên, câu (4) mình chả thấy nó ăn nhập vào công thức (*).

Mình tạm tổng kết thế này:

Overall, it is clear that there was an upward trend in the percentage of those using the Internet in each country over the period shown. While both USA and Canada had far higher proportions of the online population than Mexico, the fastes growth in Internet usage was witnessed in Canada.

Câu đầu ổn nhưng câu sau chưa ổn vì mình thấy câu này cứ tách ra, không nối được như trong công thức (*). Làm sao để câu Overview thứ hai tự nhiên hơn? Hay do mình cứ cố chấp với khuôn mẫu của (*)?

Hôm trước mình gặp được Overview này của Simon.

It is noticeable that export revenues in all but one of the five product categories increased over the period shown. While petroleum products were the highest earning exports in both years, the textile industry saw the most significant growth in earnings.

Và từ góc nhìn của mình thì Overview này có thể được tối giản như sau:

It is noticeable that… While + highest, see + growth. (**)

Nếu đối chiếu (*) và (**) thì có thể thấy cựu giám khảo không quan tâm sự khác biệt giữa hai câu phụ, miễn là có ý để miêu tả là được. Cách miêu tả của (**) thì lại rất ổn để lắp vào Overview của mình, trừ việc thiếu overall ở câu đầu. Vậy mình sẽ chốt phương án này.

Mình sưu tầm một số Overview của Simon. Mình sẽ bôi đỏ một số từ, cụm từ mình hay dùng cho (*) còn chỗ nào tác giả không quan tâm thì các bạn chịu khó tham khảo để phong cách viết thêm đa dạng.

It is clear that the total number of miles travelled by English people using all modes of transport increased significantly between 1985 and 2000. The car was by far the most used form of transport in both years.

It is clear that the car was by far the most used mode of travel in both years. Overall, English people travelled significantly more in 2000 than in 1985.

It is noticeable that in both years, 2000 and 2010, the majority of British students at the university in question were able to speak at least one other language. We can also see an increase in the proportion of second and third language speakers over the 10-year period.

Roughly speaking, close to half of Australian adults did some kind of routine physical activity in 2010. Middle aged females were the most physically active, proportionally, while males aged 35 to 44 did the least physical activity.

It is clear that elderly people and the youngest children were the most frequent visitors to A&E (accident and emergency) departments. Also, there was a slight increase in the rate of emergency care attendances among all six age groups from December 2016 to December 2017.

Lesson 159: One Original Idea and Three Overviews – GDP Growth [Bar Chart] [Overview] [Grammar 1] [Vocabulary 1] [Tutorials] [Part 3]

Đề:

The chart below shows the GDP growth per year for three countries between 2007 and 2010.

Trong phần này mình sẽ khai thác từ vựng của phần đầu. Như tiêu đề đã gợi ý, mình cố viết ba phiên bản. Tuy nhiên, ở phần hai ý tưởng chỉ đơn giản như thế này (đã bỏ bớt câu (*) vì sợ dài).

S Tunisia and Ecuador decreased, while S Japan increased.

Ai chưa nhớ rõ cách mình paraphrase thì mời đọc lại.

Phiên bản đầu tiên:

Overall, it is true that while Tunisia and Ecuador saw their GDPs decrease over the period shown, an opposite trend in the Japanese yearly GDP growth rate was observed.

Trên đây mình dùng công thức Country See Sb Do. Lý do đơn giản là vì mình viết Overview sau nên đổi cách viết cho đỡ đụng hàng.

Nếu viết đơn giản hơn thì mình ghép tạm hai phương án S vào và có:

Overall, it is true that while the annual GDP growth rates in Tunisia and Ecuador decreased considerably over the period shown, the figure for Japan increased gradually.

Cụm the yearly GDP growth rate(s) in các bạn tự ghép từ đề bài hoặc lấy trên các trang nhiều số liệu có hết.

Hoặc mình dùng Passive Voice ở vế đầu đi cho có tí khác biệt.

Overall, it is true that while decreases in Tunisia and Ecuador’s GDP growth rates were observed over the period shown, Japan’s GDP experienced steady increases annually.

Có một lưu ý quan trọng ở đây là không phải lúc nào mình cũng lôi yearly/ annual vào vì khi mình chỉ nói về một năm cụ thể thì phải bỏ cái yếu tố hàng năm đi. Ngoài ra nếu nói Japan’s GPD tăng trong giai đoạn này, giảm trong giai đoạn kia thì cũng không cần phải lôi yếu tố này vào.